Recently we had reason to investigate the performance of one of our most commonly used endpoints. We find New Relic to be a great tool for identifying and exploring performance problems, but what about when performance isn’t exactly a problem per se, but we’d like to optimize it all the same?
Often the key to understanding can be in effective visualization of the problem, so in this short post we’ll explore how to do just that using Flame Graphs.
We won’t go through this in detail, because it’s very well covered in this good blog post from 2016. We found the following development environment setup process effective:
# Gemfile
gem "ruby-prof-flamegraph"

# development.rb
config.cache_classes = true

# Controller action
profile = RubyProf.profile do
  # Action code here
end

File.open("ruby-prof-profile", "w+") do |file|
  RubyProf::FlameGraphPrinter.new(profile).print(file)
end
Fire the action locally and then convert the output to a graph using FlameGraph:
cat ruby-prof-profile | ./flamegraph.pl --countname=ms --width=1600 > flame.svgNote: Stackprof is a popular alternative to ruby-prof.
Here’s part of the graph for the endpoint in question:
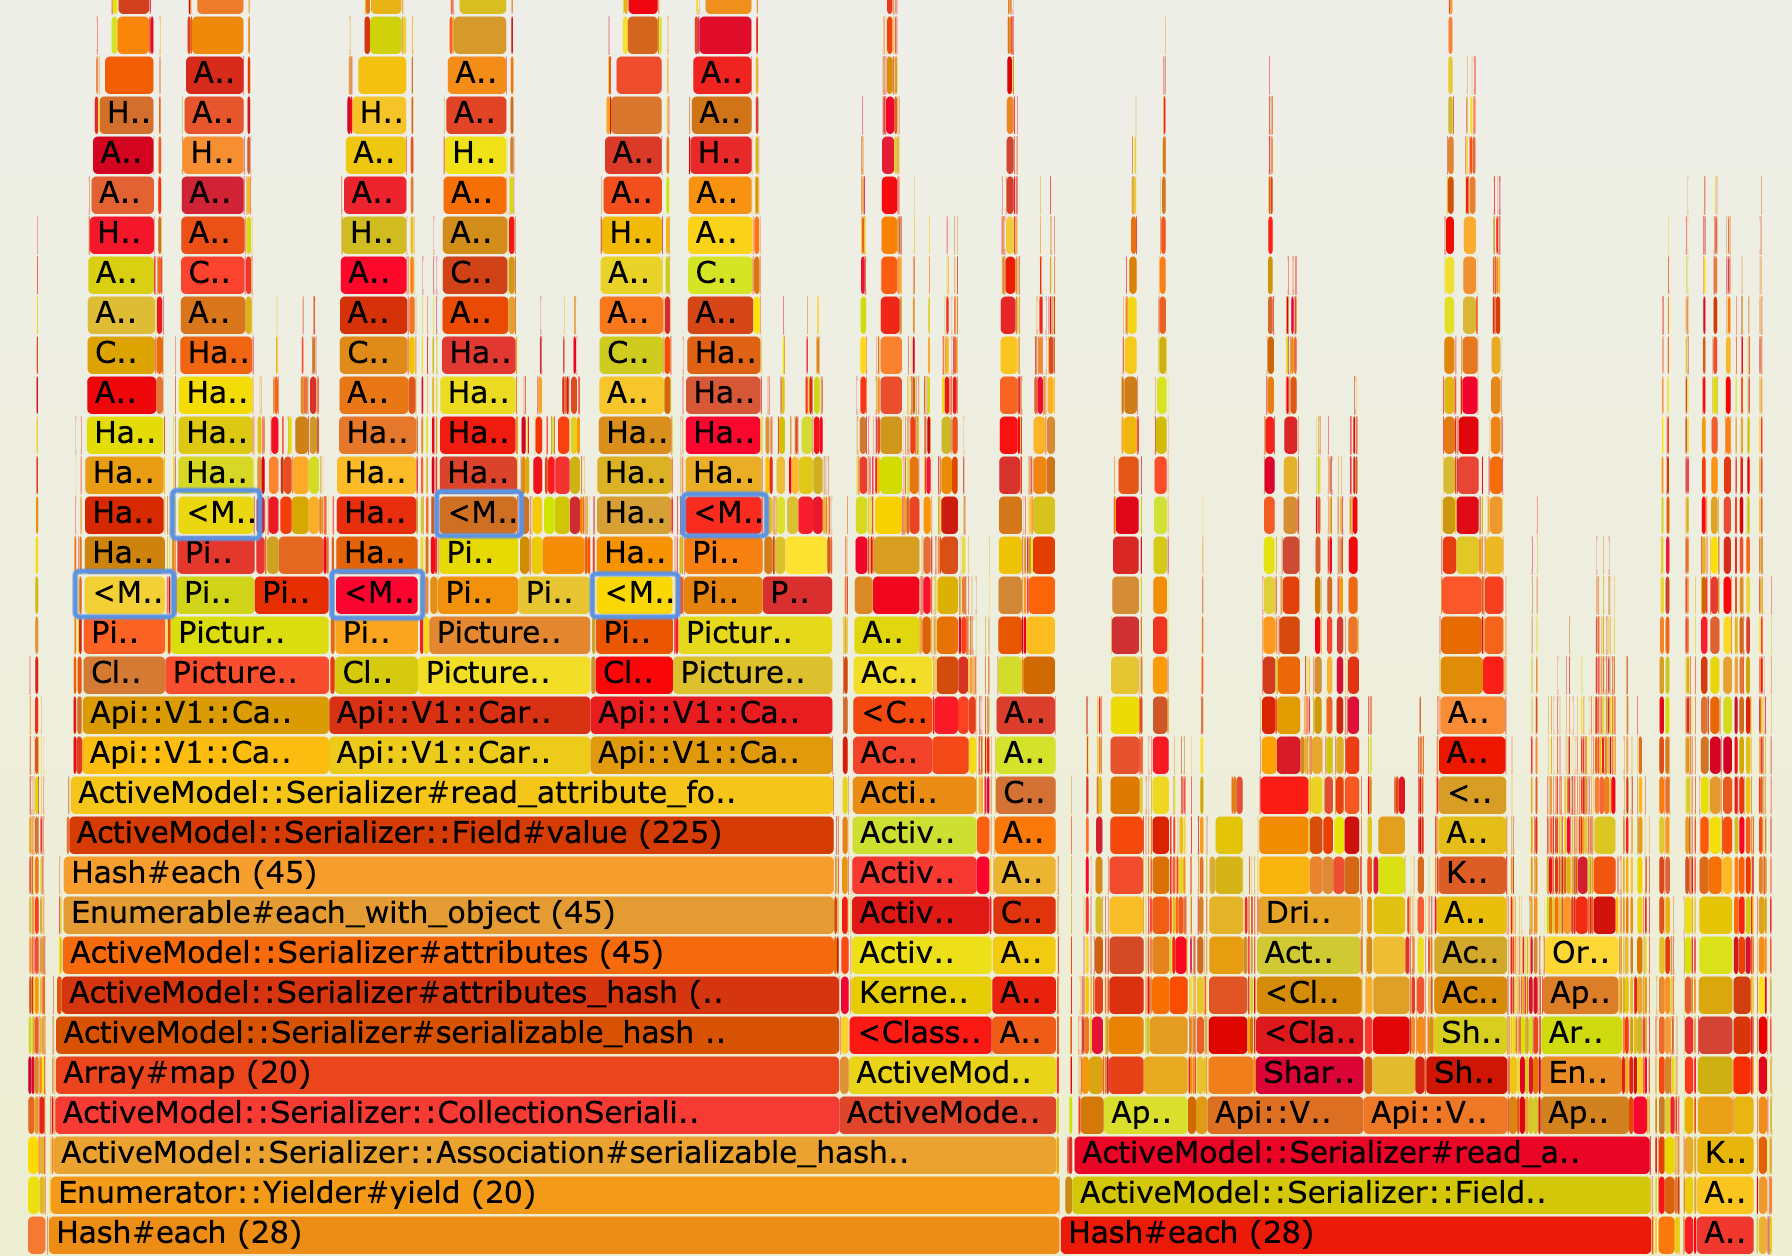

Time is represented horizontally, and the call stack is represented from bottom to top. This block of code is iterating over an array of cars and serializing a photo URL for each one, as well as some other attributes.
The parts of interest are highlighted in blue. Oddly enough, they were all calls to a simple #config method which was necessary to generate each of our photo URLs. This gets called hundreds of times by this endpoint, but it’s just a hash so that shouldn’t be a problem, right? Here’s the code:
def self.config
  SHARED_CONFIG.deep_merge(ENV_SPECIFIC_CONFIG)
end
Unfortunately, it is a problem because it’s doing a #deep_merge of our increasingly large environment config into our system-wide config every time it’s called.
Once we’ve spotted it, the memoization fix is simple:
def self.config
  @_config ||= SHARED_CONFIG.deep_merge(ENV_SPECIFIC_CONFIG)
end
Note: Take care when memoizing class methods in this way in a threaded environment: some other thread-safe store might be more appropriate for you.
Time#utc.rbspy might be a better way to go.