As Drivy continues to grow, we were interested in having more insights on the performance of our jobs, their success rate and the congestion of our queues. This would help us:
It also helps detect high failure rates and look at overall usage trends.
To setup the instrumentation we used a Sidekiq Middleware.
Sidekiq supports middlewares, quite similar to Rack, which lets you hook into the job lifecycle easily.
Server-side middlewares runs around job processing and client-side middlewares runs before pushing the job to Redis.
In our case, we’ll use a server middleware so we can measure the time of the processing and know whether the job succeeded or failed.
We use InfluxDB to store our metrics, so we’ll use the InfluxDB Ruby client but you could easily adapt this code to use StatsD, Librato, Datadog or any other system.
We instantiate our InfluxDB client with the following initialiser:
if ENV["INFLUX_INSTRUMENTATION"] == "true"
  require 'influxdb'

  INFLUXDB_CLIENT = InfluxDB::Client.new(ENV["INFLUX_DATABASE"], {
    udp: {
      host: ENV["INFLUX_HOST"],
      port: ENV["INFLUX_PORT"]
    },
    username: ENV["INFLUX_USERNAME"],
    password: ENV["INFLUX_PASSWORD"],
    time_precision: 'ns',
    discard_write_errors: true
  })
end
We’re using UDP because we chose performance over reliability. We also added the discard_write_errors flag because UDP can return (asynchronous) errors when a previous packet was received. We don’t want any kind of availability issue in our InfluxDB server to cause our instrumentation to fail. We added this flag to the official client in the following PR.
Note that we use a global InfluxDB connection to simplify our exemple, but if you’re in a threaded environment you might want to use a connection pool.
Once the connection is setup, we can start extracting the following metrics:
InfluxDB also supports the concept of tags. Tags are indexed and are used to add metadata around the metrics. We’ll add the following tags:
The middleware interface is similar to the one used by Rack - you implement a single method named call, which takes three arguments: worker, item, and queue:
worker holds the worker instance that will process the jobitem is a hash that holds information about arguments, the job ID, when the job was created and when it was enqueued, …queue holds the queue name the job is fetched fromHere’s the skeleton of our middleware:
class Drivy::Sidekiq::Middleware::Server::Influxdb
  def initialize(options={})
    @influx = options[:client] || raise("influxdb :client is missing")
  end

  def call(worker, msg, queue)
    # code goes here
  end

  private

  def elapsed(start)
    ((Time.now - start) * 1000.0).to_i
  end
end
Our middleware is instantiated with the InfluxDB client and we added a private helper to measure the time difference in milliseconds.
Now to the call code:
def call(worker, msg, queue)
  worker_name = msg['wrapped'.freeze] || worker.class.to_s
  enqueued_for = elapsed(Time.at(msg['enqueued_at']))
  start = Time.now

  data = []
  tags = { worker: worker_name, queue: queue, env: Rails.env }

  begin
    data << {
      series: "sidekiq",
      tags: tags,
      values: { count: 1, enqueued_for: enqueued_for }
    }

    # Here the job is processing
    yield

    data << {
      series: "sidekiq",
      tags: tags,
      values: { success: 1, perform: elapsed(start) }
    }
    @influx.write_points(data)
  rescue Exception
    data << { series: "sidekiq", tags: tags, values: { failure: 1 } }
    @influx.write_points(data)
    raise
  end
end
If the job succeeds we send a success point with our tags and the time the job ran (perform). If it fails, we only send a failure point with tags.
To load our middleware, we add this code to our Sidekiq initialiser:
Sidekiq.configure_server do |config|
  config.server_middleware do |chain|
    if ENV["INFLUX_INSTRUMENTATION"] == "true"
      chain.add Drivy::Sidekiq::Middleware::Server::Influxdb, client: INFLUXDB_CLIENT
    end
  end
endTo visualise our metrics, we use Grafana. It’s a great tool allowing us to graph metrics from different time series database. It can connect to different backends, supports alerting, annotations and dynamic templating.
Templating allows us to add filters to our dashboards and using the tags we defined earlier we’ll be able to filter our metrics by environment, queue or job name.
This article is not about Grafana so we’ll only show you how to build one graph. Let’s say we want to graph the average and 99th percentile time our jobs are taking to process.
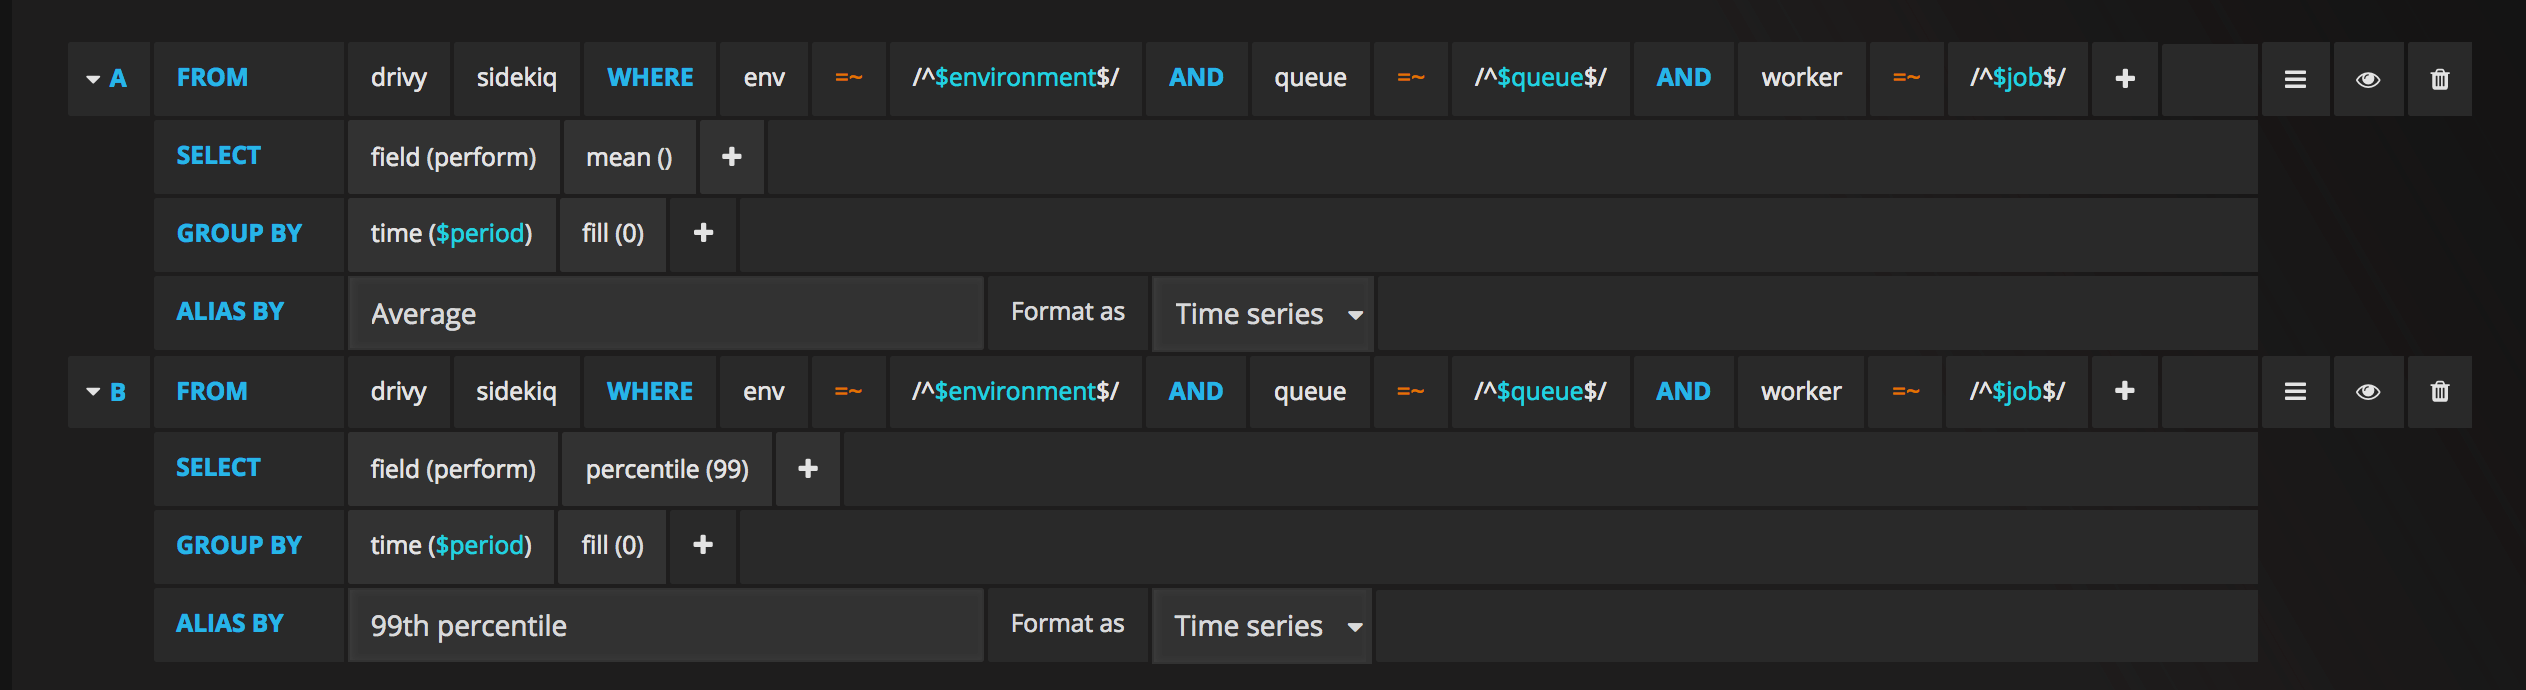
We’ll have this InfluxQL query to get the mean time:
SELECT mean("perform") FROM "drivy"."sidekiq"
WHERE "env" =~ /^$environment$/
AND "queue" =~ /^$queue$/
AND "worker" =~ /^$job$/
AND $timeFilter
GROUP BY time($period) fill(0)
Here we select the mean of the perform field that we filter by our tags then group it by time interval. We also use fill(0) to replace all the null points with 0.
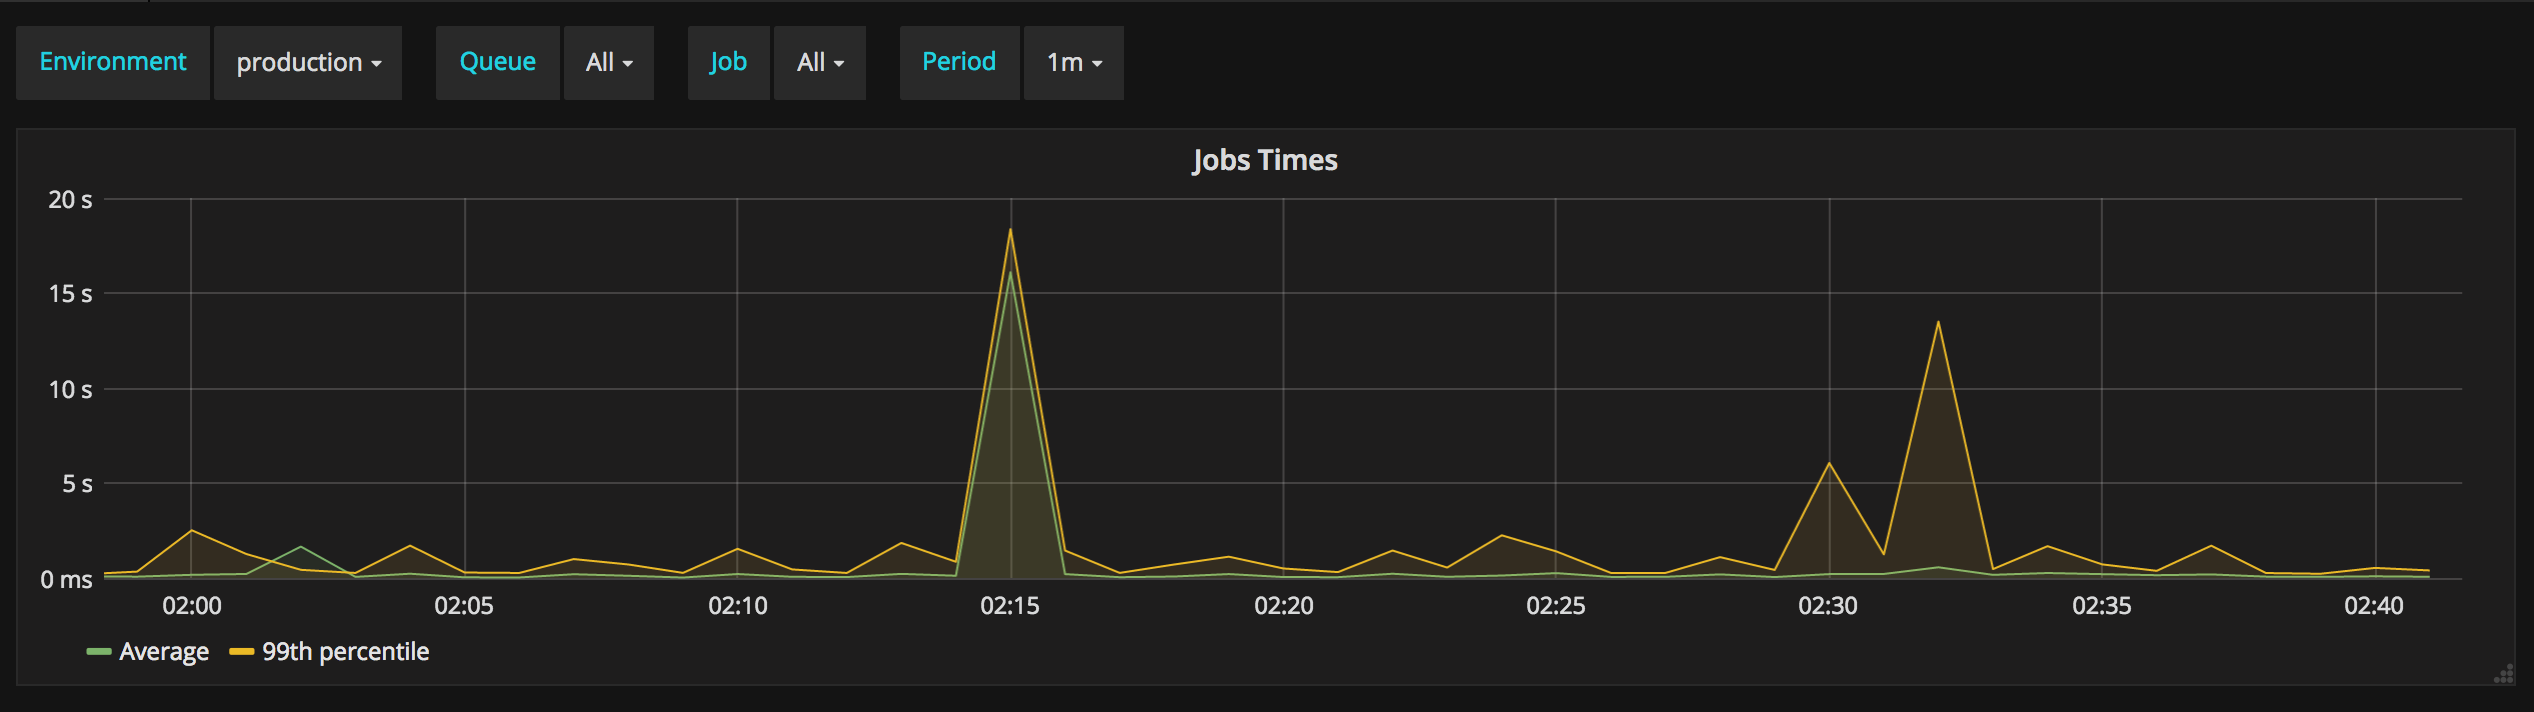
To get the 99th percentile we use the same query but replace mean("perform") by percentile("perform", 99).
Here how this graph looks in Grafana:
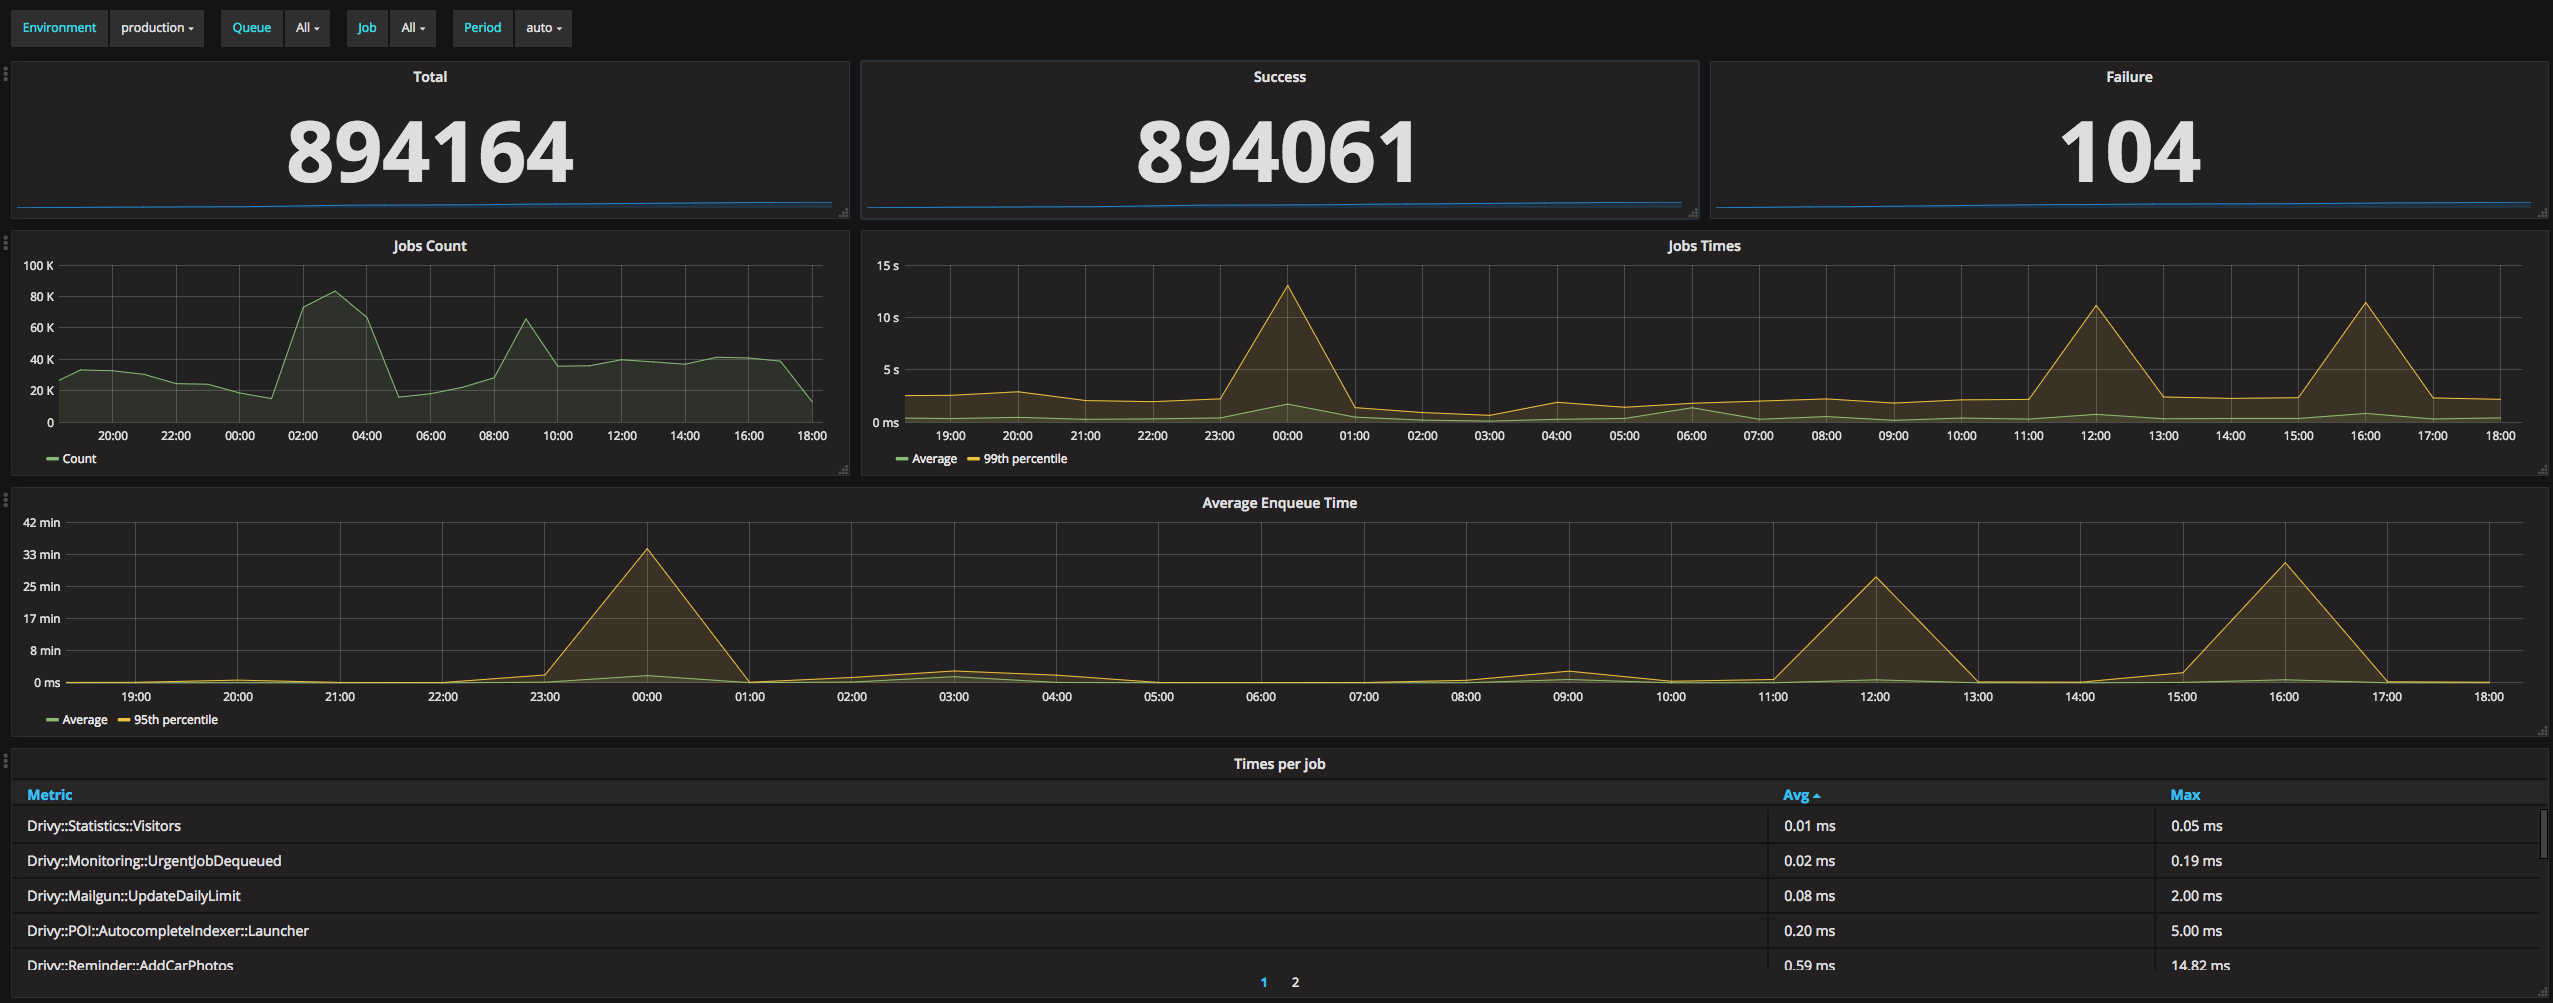
And here’s our whole dashboard:
The next step would probably be to add some alerting. At Drivy, we alert on the rate of failure and on the queue congestion so we can reorganize our queues or scale our workers accordingly. Grafana supports alerting but that’s probably out of the scope of this article.
Instrumenting Sidekiq has been a big win for our team. It helps us better organize our queues, follow the performance of our jobs, detect anomalies or investigate some bugs.