At Getaround, like at any other company, we sometimes experience incidents that negatively affect our product.
A couple of weeks ago from the time of writing, I released a feature that contained a seemingly harmless SQL query that returned the total balance of a user. This calculation was previously made on the fly with Ruby every time a user loaded a page where this was needed. This was particularly problematic with owners that had many cars and the query was slow to load, sometimes causing timeouts. So the commit that I had deployed was meant to counter this problem by using a table that was built exactly for this purpose. Instead, it brought the CPU utilisation to go over 90% and slowed down all database queries, causing timeouts all over the site
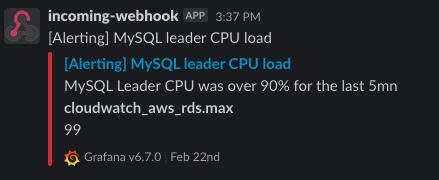
We use Grafana for monitoring, and we use a Slack webhook integration that let us know when certain events happen. In this case, 13 minutes after my code was live, we get a notification on Slack on a dedicated channel letting us know that there is a problem

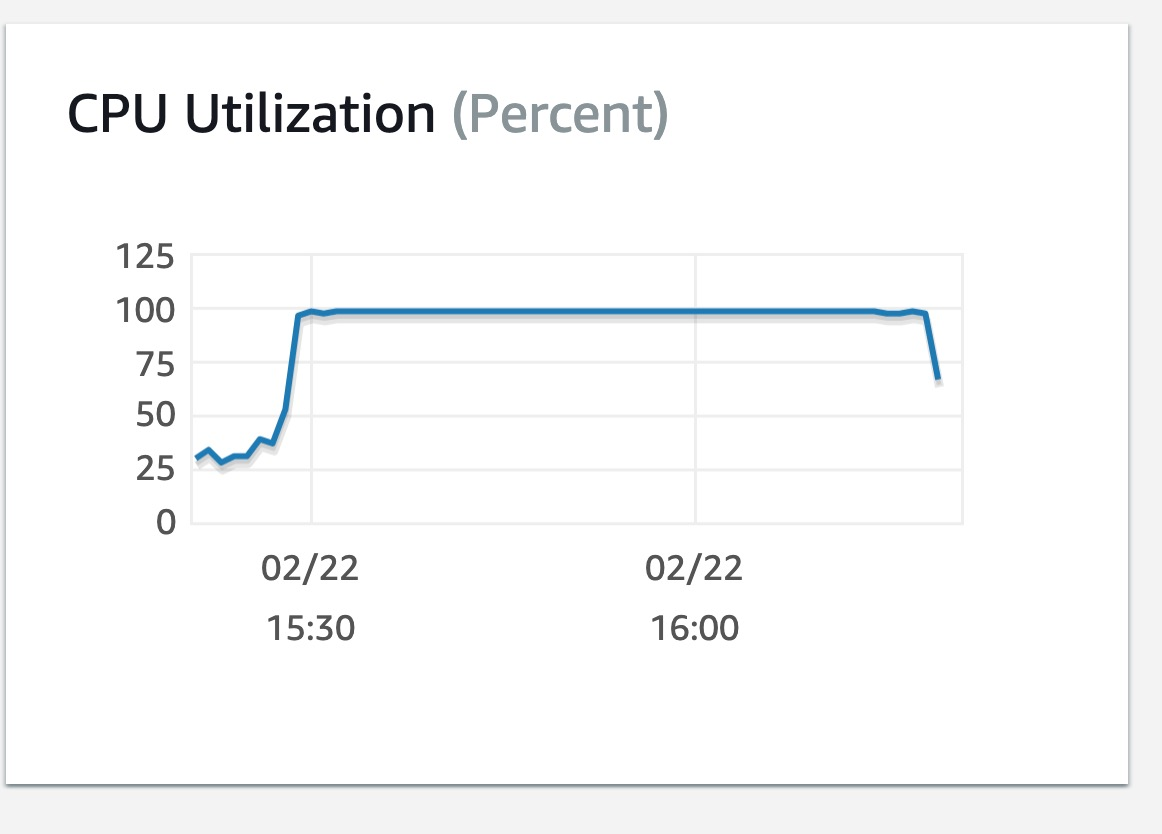
After looking at the CPU utilization graph and some further investigation, my commit is rolled back.

Despite the rollback, MySQL was still busy running the existing queries and the CPU utilization did not diminish, but after a couple of back and forth, and communicating with the rest of the company what was going on in the perfectly named #war-room channel in Slack, the issue was under control in less than an hour 🎉

At Getaround we keep a record of all the technical incidents that have happened, and each entry on the list contains a couple of things:
This is also called a Postmortem and it is an important step after an incident. The goal being to be able to share knowledge with your colleagues and try to prevent it from happening in the future as much as we can, all while acknowledging that incident are a normal part of software development. It is essential that a blameless culture exists in the company in order to be able for everyone to write in detail freely about what went wrong so we can learn from our mistakes. The Post mortem for this incident in particular would look similar to this:
15:24 - A release was made containing the commit which included the slow query
15:37 - Team was alerted on Slack about about a high CPU load
15:44 - The team identified the issue (high CPU load) to be related with the release at 15:24
15:46 - Commit rolled back
15:52 - After noticing that the CPU usage does not decrease, even after the rollback, it is identified that the db is still busy running the queries that it had enqueued
16:00 - Incident opened in New Relic (monitoring tool used at Getaround)
16:15 - Command launched to kill lingering db queries
16:23 - CPU load back to normal
23:48 - Incident on New Relic closed
User searches started timing out and there was an uptick of incidents on Bugsnag
The combination of an underperforming query and the fact that it was a query used across many different placed caused the overload.
The offending code was:
Balance
  .where(entity_type: 'User')
  .where(target_type: 'User')
  .where(entity_id: user_id)
  .group(:country, :entity_id)
The problem was is not obvious at first, but after trying to understand what the query was doing with EXPLAIN it turns out that the query was not fully taking advantage of all of the indexes that we had in place, which means it scanned way more columns than it needed to. After the query was optimised to take advantage of the indexes, the number of examined rows returned by running EXPLAIN came down from 3468 to 4. So… yeah, big improvement.
Although we are able to objectively point towards the code that caused the incident, there are also other, more subtle factors that contributed for this code to be overlooked and committed. For example:
The rollback of the offending code caused the queries to stop enqueuing themselves on an already stressed database and the killing of lingering processes managed to solve the incident completely. After finding the ids of the processes to kill, the following command was executed:
cat ~/Downloads/ids-to-kill | while read -r a; do echo $a | mysql --user <USER> --host <HOST> --password=<PASSWORD> ; doneAfter finding out that using a where condition for entities was an overkill, the query was rewritten to take advantage on the existing indexes and a promising indicator that it was a good solution was that the rows to be examined dropped from 3468 to only 4
In the original Post-Mortem I added the links to relevant places like the Slack, or the New Relic incident link, but in this public version I’ll omit some of them 😬


Postmortems are a great practice that help make the best out of bad situations when they happen, since incidents are not a matter of wether they will happen, but of when they will happen, and the best way to minimize the potential negative impact is for the team to be aware of potential pitfalls, this requires that everyone can feel free to go into detail about how their actions led to an undesirable outcome.